Demo/Code
Demo is located here, and the source can be viewed on GitHub here.
Info
During the spring semester of my senior year at MIT (2021), I took a class titled Iteractive Data Visualization (6.859 at the time, though that number is probably outdated). The class focused heavily on learning D3.js, and the final project was a rather open ended visualization that we could create in groups.
My partner and I wanted to do something related to legalization of marijuana, but eventually, we landed on coming up with some interactive visuals for incarceration rates in the US.
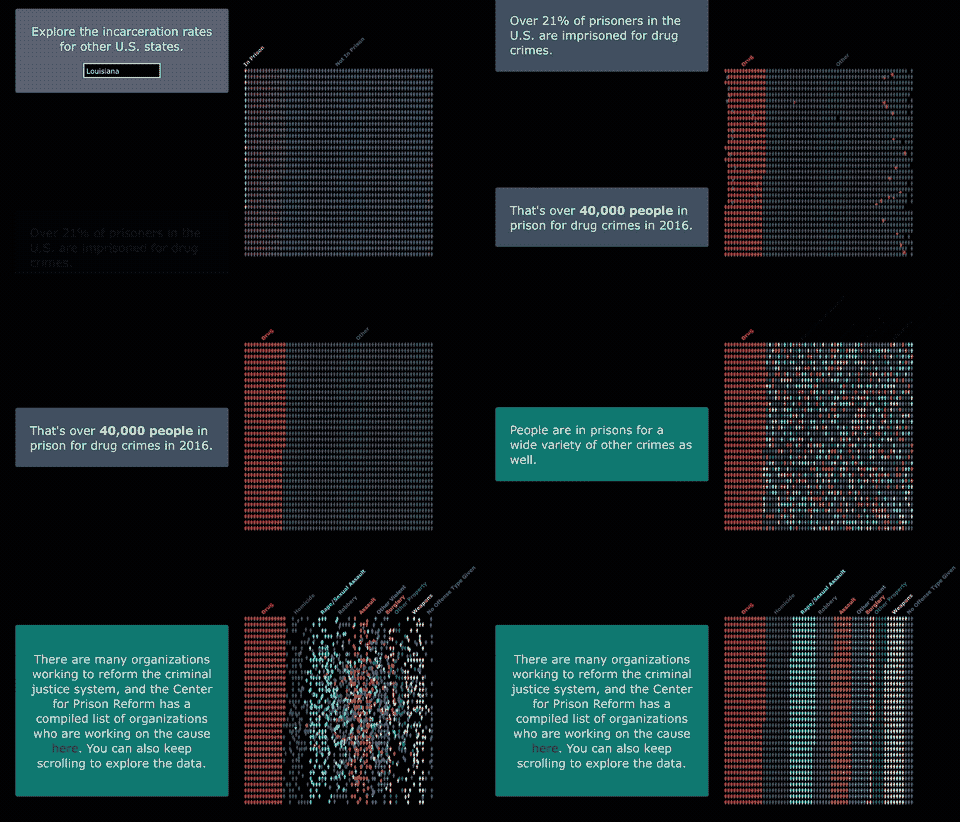
The crux of the visualization revolves around a grid of people icons that moves into groups to show ratios of categories within a population. We wanted to randomly, proportionally give icons a color based on category, and then have them move. This grid was done with D3.js, but there were a few challenges in getting it to look pretty:
- Some of the icons didn’t actually need to move. By staying in one spot, they could make the overall visual look much cleaner. They were already in the right spot. Accomplishing this wasn’t a crazy task, but it did involve preselecting icons to not move, with a sort of bucket system for which indices were taken (i.e we needed to make sure that if one icon wasn’t going to move, then no other icon would try to move into the same location).
- We wanted the icons to all move at the same speed. However, since D3.js only allowed transitions times to be set, we had to do a bit of math to set the transition time based on how far an icon would have to move.
- We ran into some performance issues with trying to move a huge grid of icons all at once. Oddly enough, randomly delaying each icon’s transition start both solved this problem and made the visualization appear a bit more like a natural crowd moving.
The end result from moving the people is this:

While the code definitely is not the cleanest (this was early days of getting comfortable with JavaScript and the browser), the final product is relatively cool, and being able to iterate and improve on the people moving was very satisfying.